The spring market is coming, and so is the spring marketing. If you are reading headlines and looking at charts, you will likely come up with the wrong conclusion. Below, I will show you some liar’s graphs. But first, the data those graphs were based on.
The actual data (from Zillow):
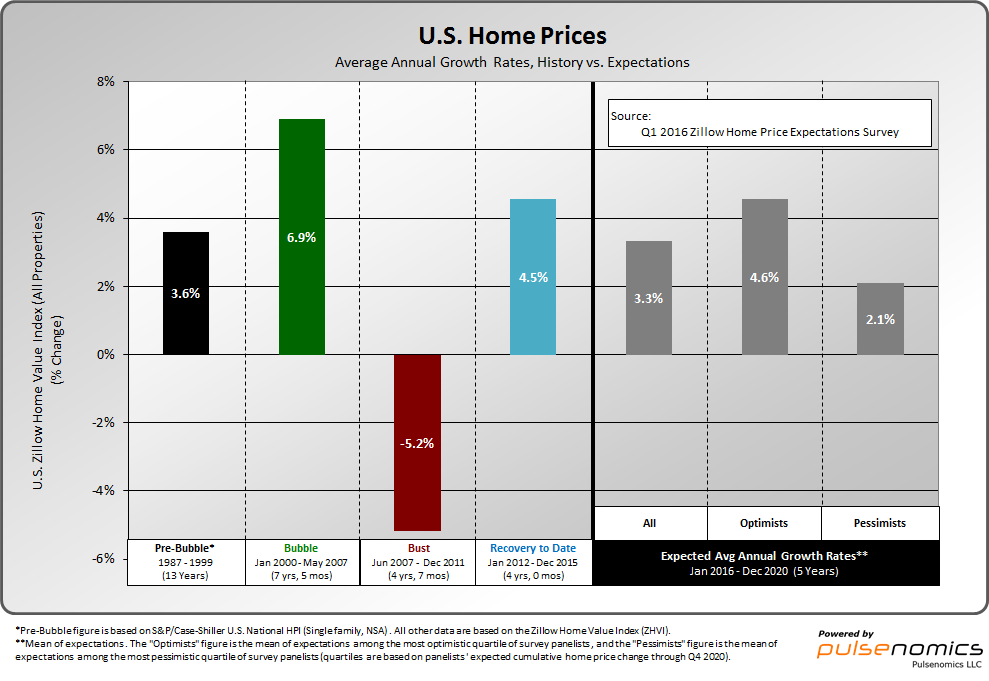 The real estate economy is fairly consistent, over time. Housing prices rise, on average, 2-4 percent a year. When they rise faster than that, the economy has problems and prices fall.
Housing is a safe long-term investment in economically stable areas, like greater Boston.
Housing is not a reliable quick-profit center unless you are in the business of improving and selling (nicknamed “flipping”). It takes cash to improve a property. Investors lose when they under-estimate the cost of renovation, or buy too high, or get caught at the top of the market. A lot of the appreciation buyers see in housing prices are because of the moneys spent on new kitchens and bathrooms, painting, landscaping, and otherwise improving the old housing stock.
The predictions were, well, predictable.
 The optimists predicted the market would outperform normal market conditions; the pessimists predicted that the market would under-perform normal market conditions. On average, the market was expected to slightly under-perform its historical norms.
All experts predicted an annual growth rate of 2.8-4.5 percent annually.
That is a far cry from what most consumers think the market increases are.
Based on the charts above, a well-subscribed real estate blog published this headline and graph:
Future Home Values: Where Do The Experts Think They Are Headed?
OK, that picture says a thousand words. None of them are true. Well, one is true; prices are going up.
This was followed up with these two “informative” charts:
 Projected mean average appreciation: Yes, it is true that the projected increases in prices varies between 3.7-3.1 percent. This chart uses typical tricks to exaggerate the difference. The 3.7 percent bar is different color; this draws our eye to it and distorts the look of the bar. (it is darker, thus looks taller and thinner.) Also, the 3.7 percent is the top of the chart. If this were graphed on a chart from 0 to 100, the difference would be a tiny, tiny blip.
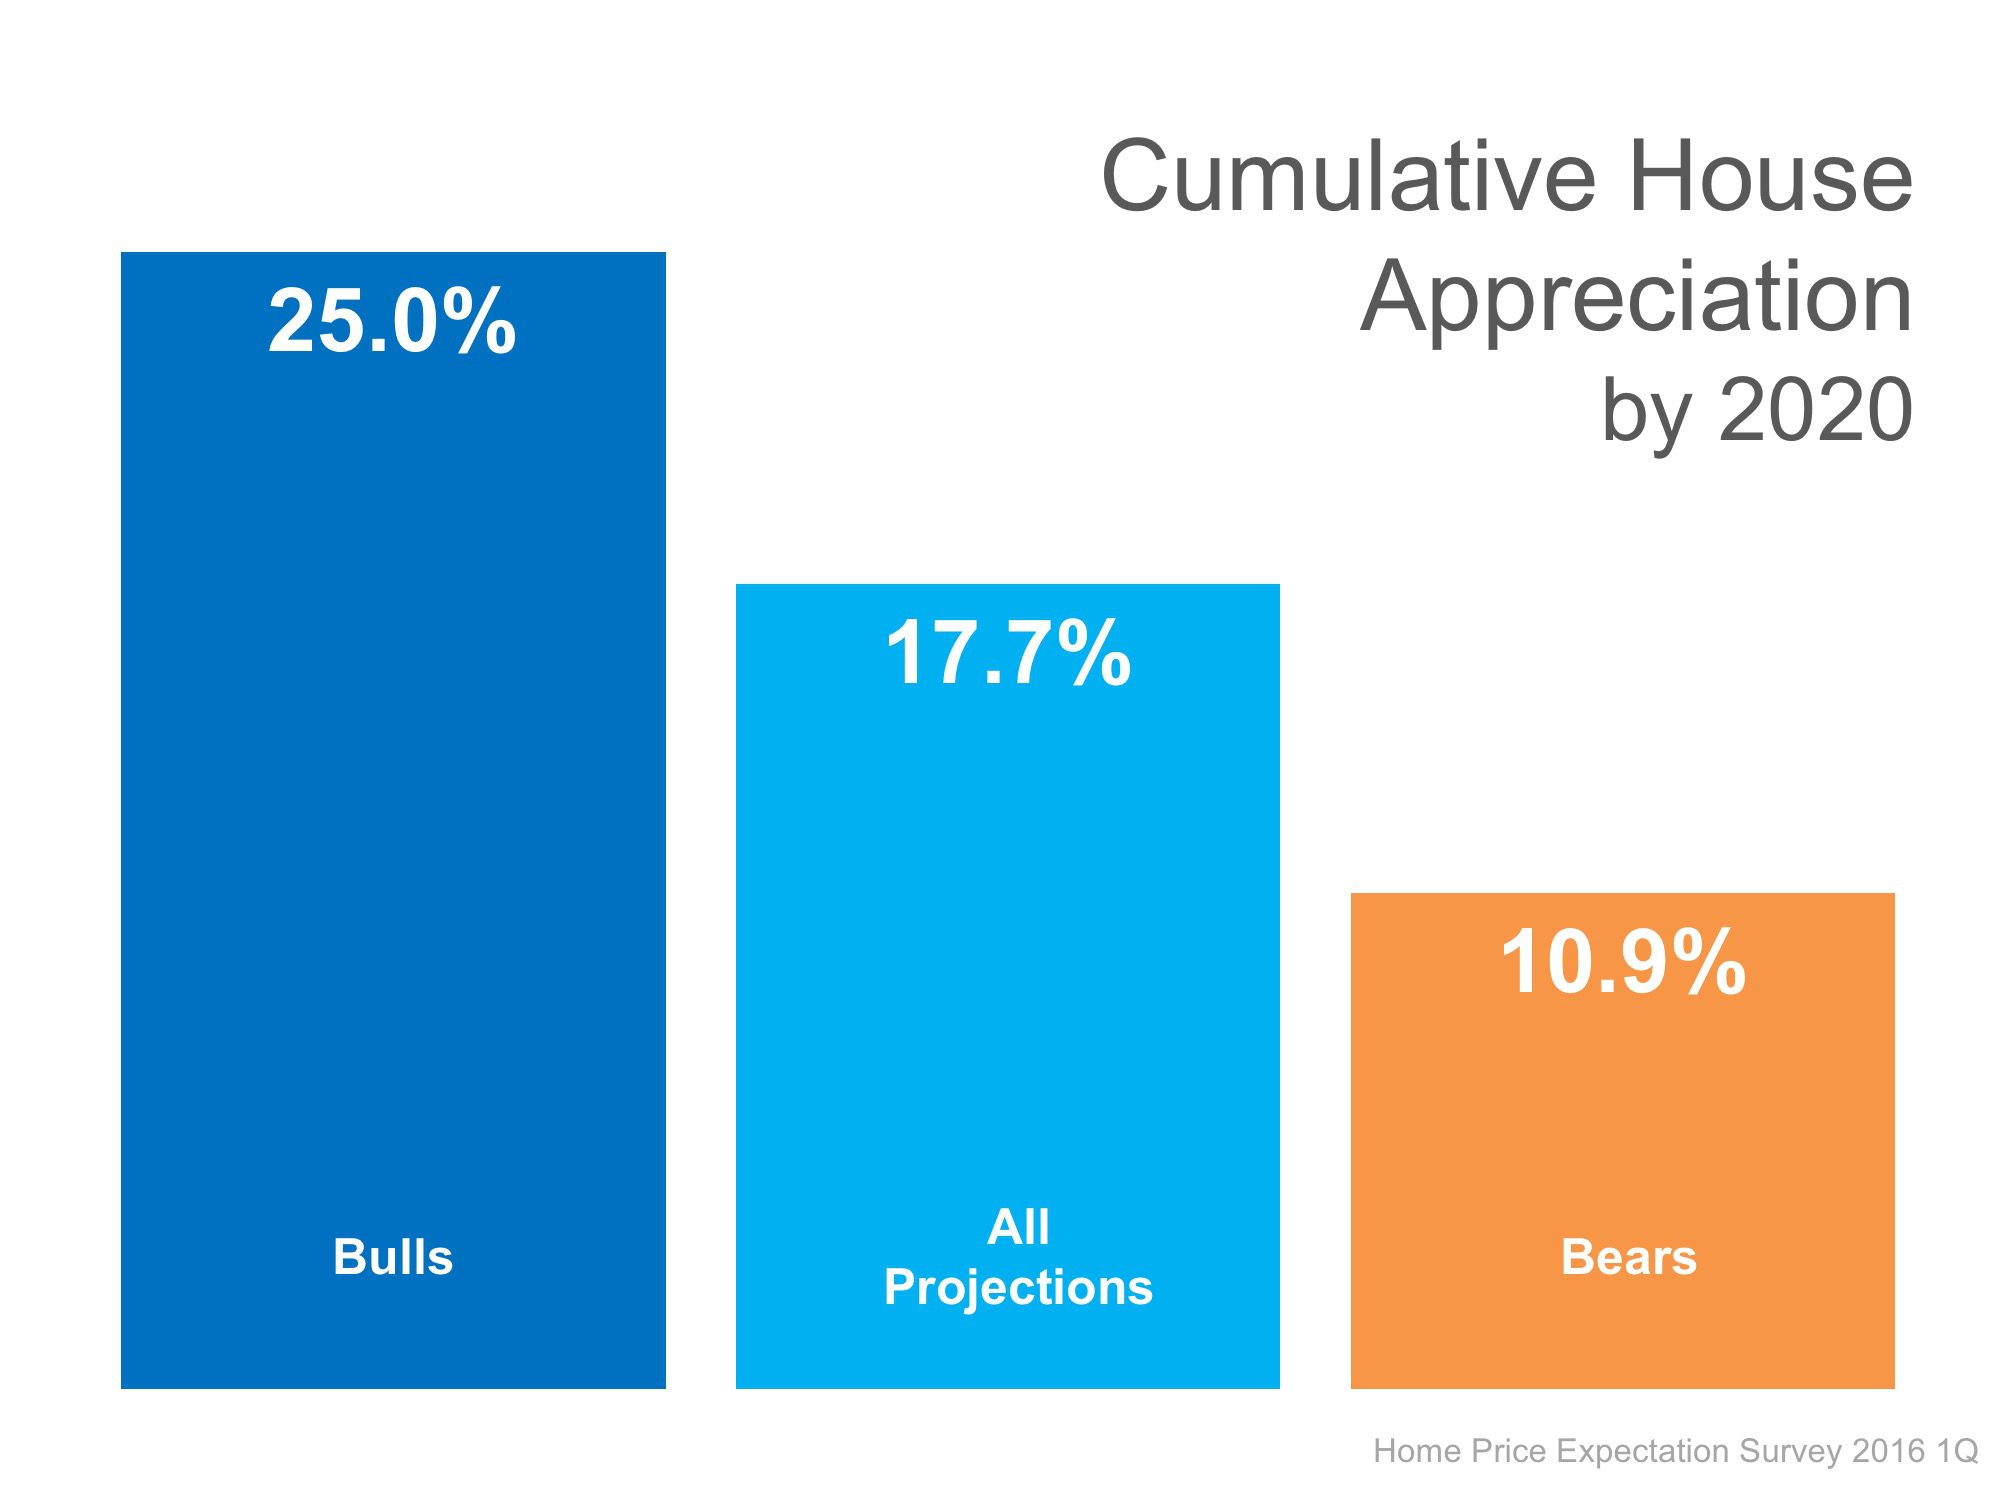 Cumulative house appreciation by 2020: The projection chart is all well and good. Of course, over time, the price increase is much more: it increases geometrically. This chart also uses color and a short scale to exaggerate the difference in the figures.
Let me remind you, this is a projection. If one were to ask the experts if they expect consistent appreciation over the next four years, the answer would likely be “Of course not!”
So what’s the point of this kind of charting?
Make buyers anxious: The graphic with the houses and the headline is designed to frighten buyers. The lazy would-be buyers, will look at the title and the graphic, then click on. Their worst fear of inflation gets confirmed. “Future Home Values: Where Do The Experts Think They Are Headed?” Up and up and up and up.
Make sellers anxious: The projected mean percentage appreciation graph is a lesson for potential sellers. The rate of price growth is projected to go down. So, the message is: sell now! Many people won’t think it through. Appreciation is cumulative — there is no loss involved in selling later. But the chart can create the impression that a seller will get less by selling later.
Confirm expectations: The cumulative house appreciation chart, on the other hand, shows whatever the reader wants to believe. A bullish (expecting inflation) reader will note the 25 percent figure, and the bearish (expecting a weak market) reader will note the 10.9 percent figure.
Buyers and sellers respond to their fear of loss. Buyers who think the market is running away from them will spend more wildly. Sellers who think their profits are dwindling, will sell more quickly. Both of these conditions benefit real estate agents. But do they benefit you?
Leave A Comment