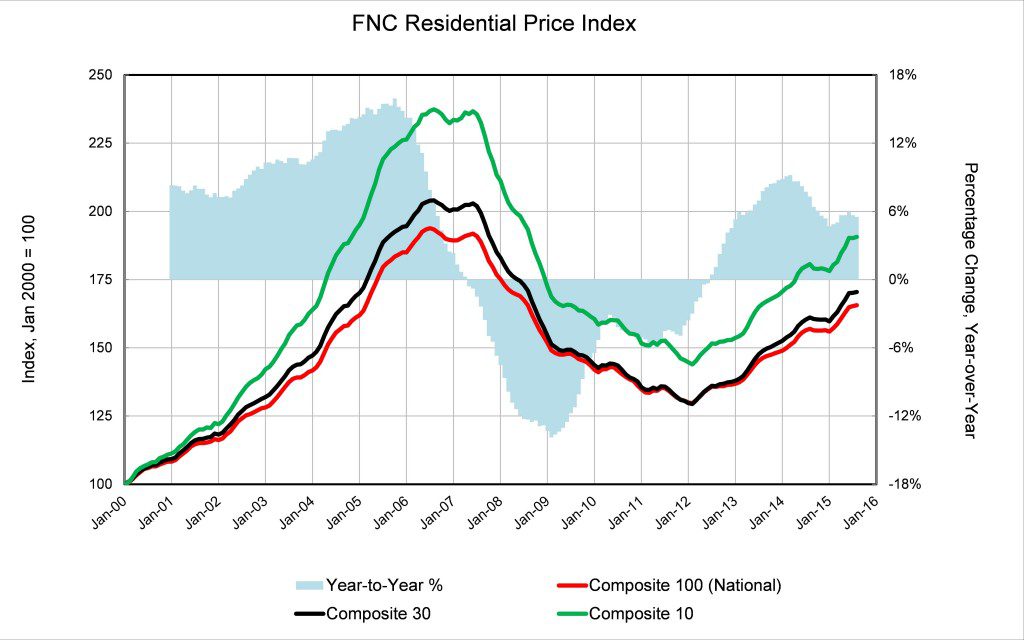
 The national survey numbers on real estate prices for the third quarter of 2015 are here on theis chart. Notice the bubble lines on the three levels of composite indexes that FNC creates. They are pretty pronounced. All lines are headed upward. Yet, we are nowhere near the top of that bubble, on average. The blue shaded area also shows a steady, year-over-year increase to the positive.
The Northeast data is limited to New York and Boston. Look here at Boston Metropolitan Statistical Area (MSA) compared to New York MSA. Click the green “compare” button to get a line graph. Boston outstripped New York’s growth rate in January 2014, and has been inflating a bit faster ever since. This is consistent with the seller’s market that our office has been working in for the past two years. It’s taken a lot of fancy footwork to keep buyers in the game under these conditions.
Real estate is very local. In the area where I work, there has been sharper increases in certain kinds of housing or specific locations. FNC (and other valuation systems) count metro Boson as a very large area that runs down to Quincy as well as north to where I work, some of the less resilient markets drag down the average. In our primary towns of Somerville, Cambridge, Arlington and Belmont, areas near town squares and near transportation were most robust. Properties that were priced properly sold quickly.
The answer to the big question is:
In the Boston MSA, prices have increased a whopping 38.7 percent from the bottom of the market. The increase year-over-year is a healthy 6.8 percent, over the whole region.
P.S. This blog entry is based on the work of my very favorite valuation system, FNC. Other valuation systems are giving overall higher numbers. Be aware that any national number is irrelevant to your search. Even the local numbers are done in too broad an area to really matter. What will help you to decide what to pay for your house or condo is a full comparative market analysis on the specific property along with watching the local sales, generally, before you make any offer.
FNC looks at all non-distressed (non-foreclosing) properties. FNC includes information about house improvements (or lack thereof.) Here around Boston, where house condition is a key factor in valuation, FNC gives me the best information.
Think about this. If someone buys a house that is run down for $350,000 and puts $150,000 into it in repairs, then sells it for $725,000, most valuations systems will assume a roughly $375,000 profit. But, after renovation, the profit is closer to $225,000. (Of course, there are other costs such as debt service, brokerage, time, and opportunity cost in every house flip.) Buyers in my area have been paying more, but they are paying more for houses in better condition.

Leave A Comment